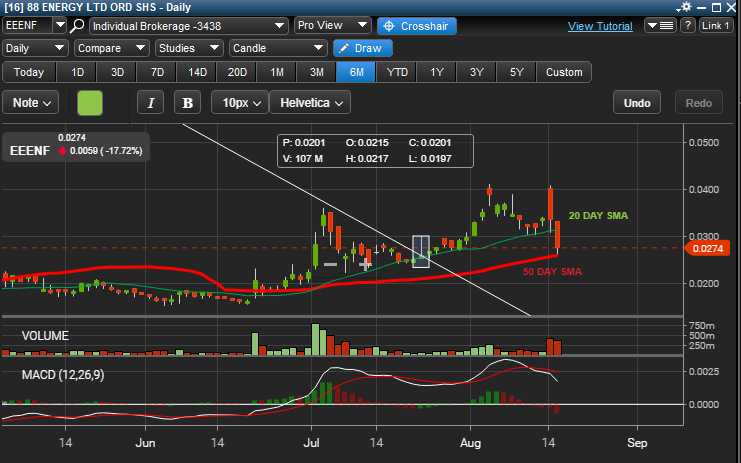
$EEENF I really thought she would bounce off the 20 day SMA! She dipped further and down to the 50day SMA on the daily chart. usually this indicates a bottom! Further, we are still in a reversal technical pattern. I honeslty believe she will hold above the 50day SMA, when I say above, we are looking at the hourly chart, this timeframe provides a further outlook, she can dip below the 50day within the hour but when that bar hits those 0's we want her to be at or above the 50day SMA. 0.033 by on Fridays close to confirm the reversal is still in play anything under, we can see a bounce back down.
Like
Comment
Share