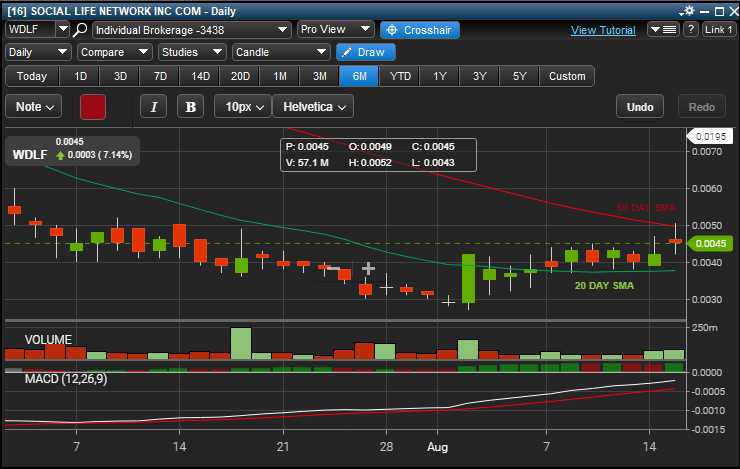
$WDLF is my latest play and am infatuated with the char. The technical chart looks really well, bullish flag and a reversal coming into play with higher highs and higher lows the last 2 trading weeks. $WDLF is in a trading range between the 20day SMA & 50day SMA. Once the 20day SMA breaks over the 50day SMA a run to the upside will be ignited. The chart indicates it may take 2 weeks or so to get there. However, the news, announcements, & videos $WDLF has been dropping the last few days she just may run before the technical chart is fully developed.
Like
Comment
Share